Reconciling the historical trend with the local trend:
When we have looked at historical data we have often seen this trend: 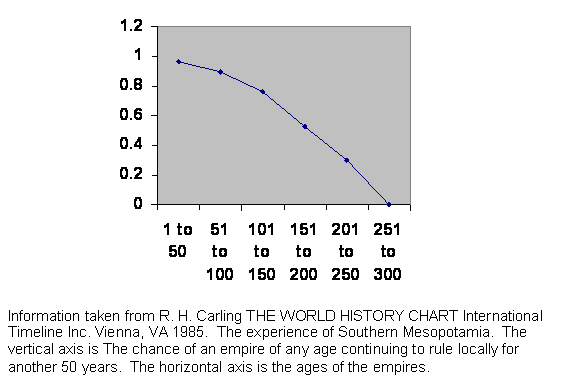
This is Mesopotamia, but we have seen the same pattern regularly. There is often a smooth decline in the probability of survival of a regime over time. It is axiomatic that the fewer young people there are the less chance of survival there is. But when we look at an individual population we regularly get this pattern:
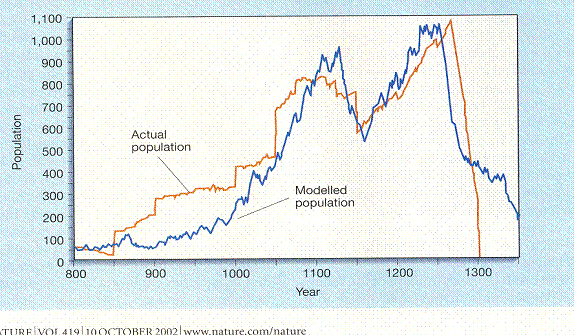
Jared M. Diamond, “Life with the Artificial Anasazi,” NATURE, vol 419 no 6907, October 10, 2002 p 567.
While empires die out over a 300 year span, individual populations rise and fall over a 150 year span. What gives? I have said in the past that the rise of an empire does not depend on its age but the age of the dying one that is being replaced. So empires strut onto the stage of history at a random point in their life cycle. That life cycle is reflected in the red curve above.
The result of random recruitment smudges out the short cycle. That’s what I’ve said. So let me show you how it works. No real data here, just numbers I am pulling out of the air.
Here is a model of a population:
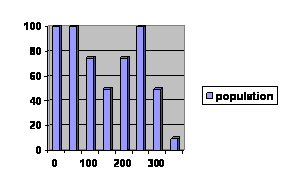
The population starts high. After all, this is an empire. Then it falls, rises and crashes much like the Long House Valley population. But if the empire becomes visible at some random course in its history, then it is as if we averaged 7 empires that came in at 50 year intervals. That is not random, but it is what random approximates.
Here are 7 such empires:
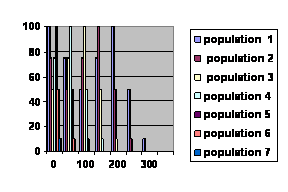
Those are all the populations over time. It is not quite clear what is going on. But if we go to each individual age and take an average population size, we get this:
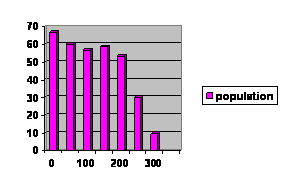
It isn’t perfect. It isn’t even pretty. As usual, my mathematical model is not as clean as real life. But you can see it begins to look a lot like the Mesopotamian experience. With more than 7 empires and introducing them at random rather than strict 50 year intervals, that last remaining notch will doubtless be blurred out, and the characteristic downward curve is explained without invoking anything further.
There have been 4,144 visitors so far.
Home page.


